Get YMTracker & DRIPCalc Earnings Data
- YieldMax PNL Tracker (YMTracker)
- Earning & Dividend Data
- Stock Compare Tools with Earnings Data
Get 3 months FREE!
NEW: We recently developed and added YieldMax PNL Tracker [YMTracker] all DRIPCalc membership levels!
The YieldMax ETF Dividend & PNL Tracker is a sophisticated tool tailored for investors seeking deep insights into YieldMax ETFs. It meticulously analyzes trades, holdings, and profit/loss (PNL) for each distribution cycle, offering a clear view of fund performance.
Whether you’re tracking MSTY, NVDY, or ULTY, etc, this tool provides real-time data to monitor your investments with precision, and get up-to date ALGO Dividend Estimate for YieldMax ETFs.
Try a fully functional YMTracker DEMO for CHPY (weekly) and XOMO (group A) ETFs, to explore features such as Holdings & Trades tracker, Distribution Estimate, Dividends & Shares Outstanding History, etc.
![]()
Discover the Power of DRIPCalc PRO
DRIPCalc PRO, designed by and for Dividend Investors, surpasses conventional tools by offering unique insights through our innovative “combo reports.” These reports allow you to visualize critical metrics such as dividend yield and growth rate side by side, enabling comprehensive stock comparisons at a glance.
Experience the advantage of assessing multiple companies simultaneously, identifying trends, and making informed decisions with unparalleled ease. DRIPCalc PRO not only fills the gaps left by other platforms but also elevates your investment strategy with its depth of analysis and user-friendly interface.
Join us to transform your dividend investment approach with DRIPCalc PRO.
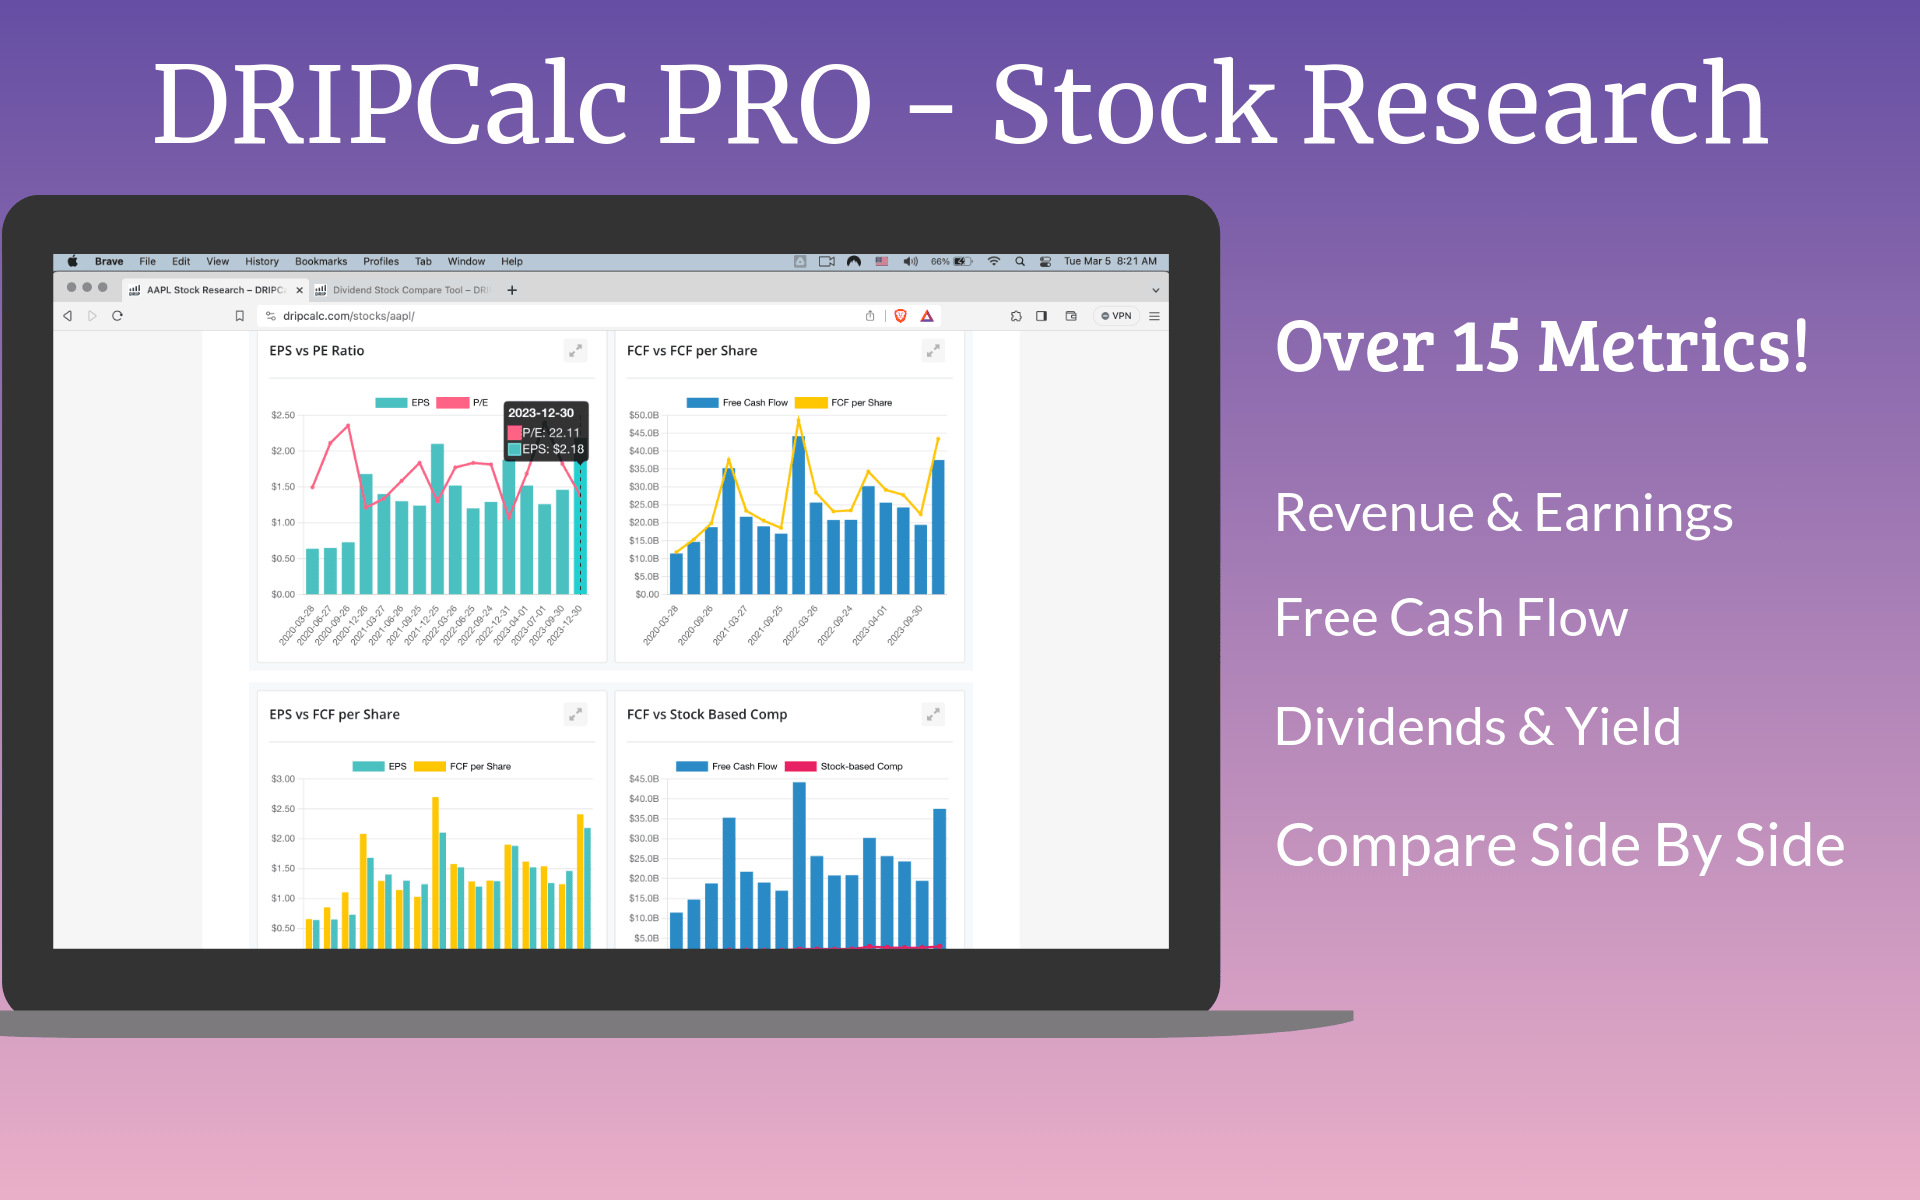
– Dividend Payments + Yield
– EPS + PE Ratio
– Free Cash Flow + FCF per Share
– Net Income + Revenue
– Company Cash + Long Term Debt
And much more…
Research your favorite stock:
Research Your Favorite Stock:
To make your research easier for most charts with single metric, we also included CAGR or Compound Annual Growth Rate, for 1, 2, 5, and 10 year periods. This way you can easily see if the company in growing or stagnating.
Compare Two Companies Side-By-Side:
You get same reports as in single-stock insights, but run them in parallel! This allows you to quickly see which company is doing better in specific metrics that are important to you!
Our compare tool allows you to pick the winner without switching between multiple tabs and forgetting that “number from the other stock”!
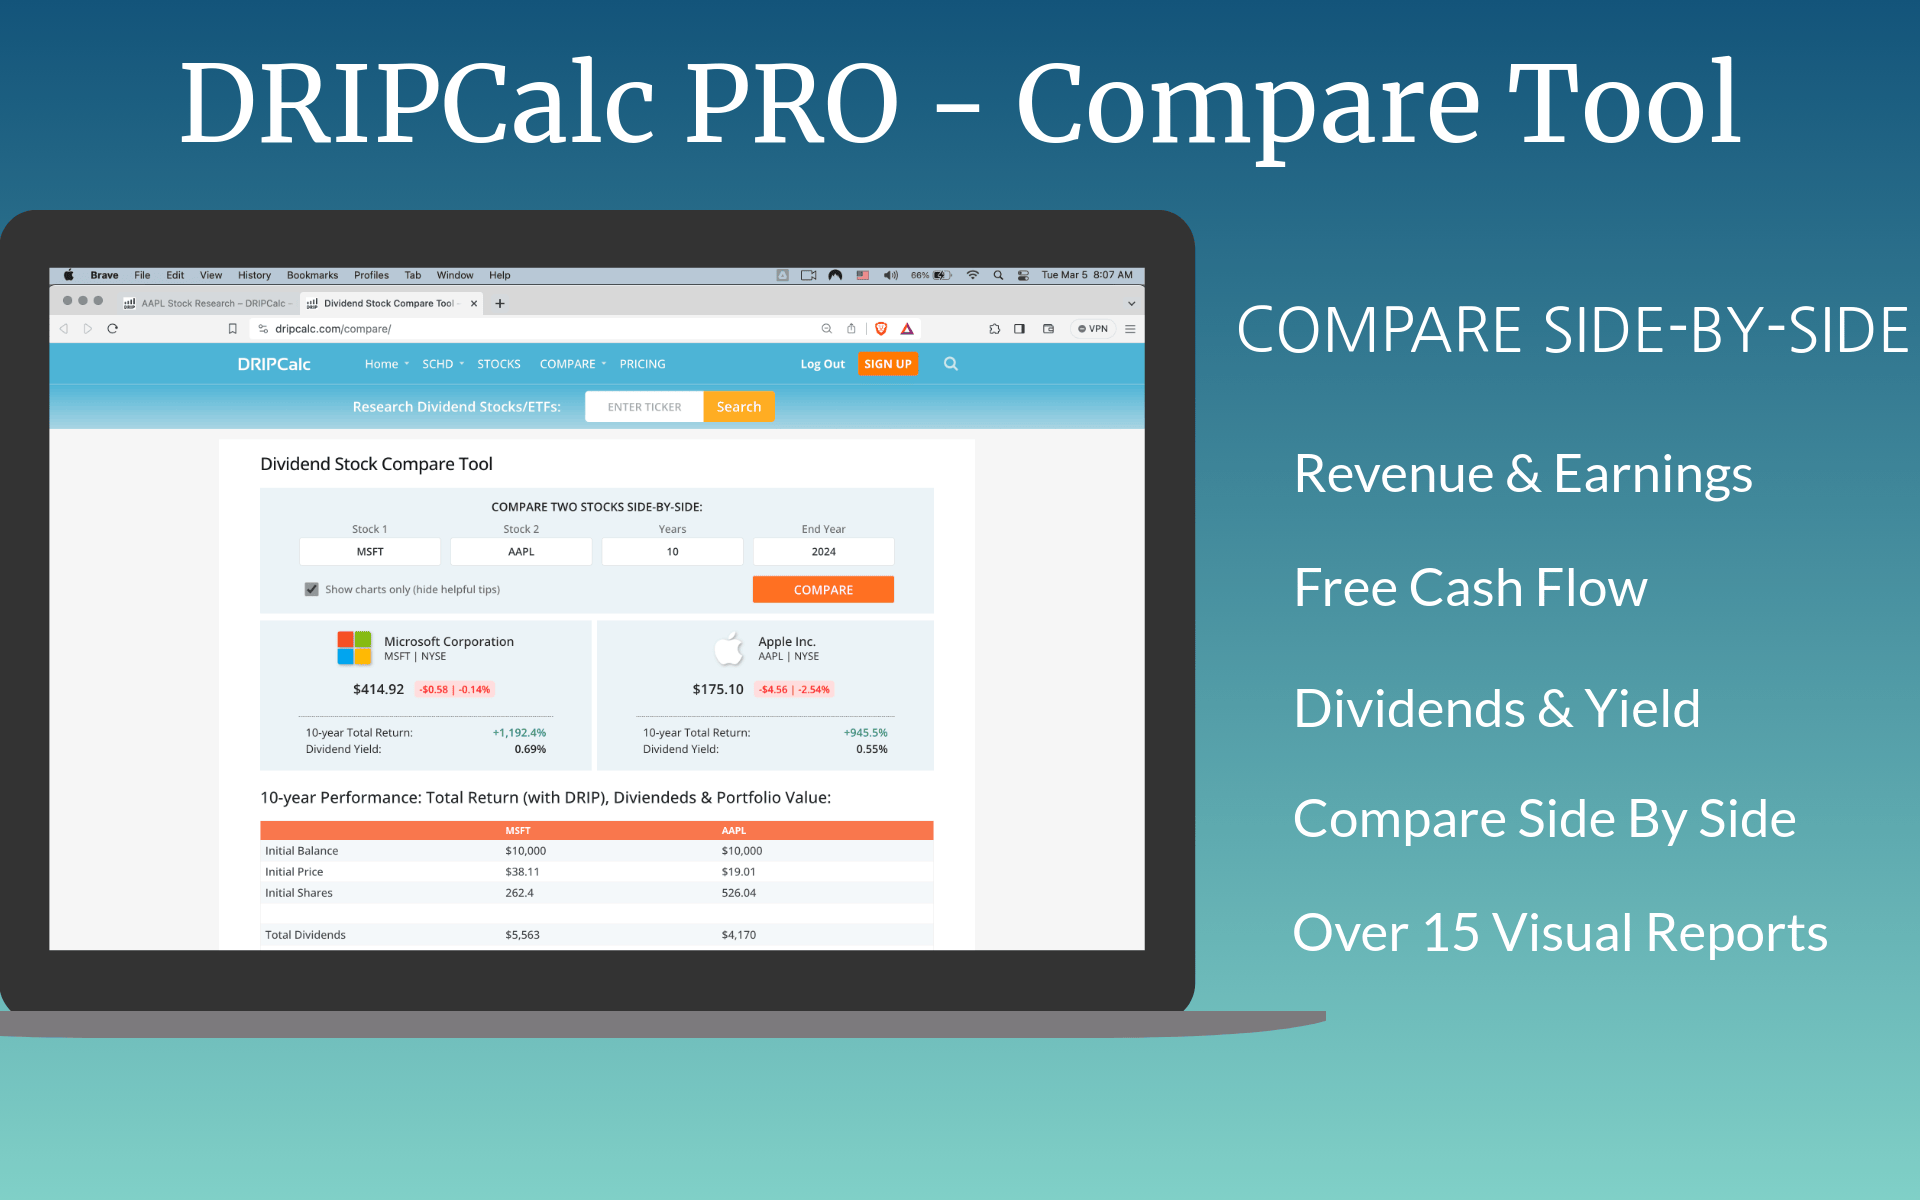
We spent hundreds of hours perfecting this tool, the multi-metric charts, and making it all war seamlessly together.
See our COMPARE tool in action, comparing two biggest public companies in the world – MSFT vs AAPL, or use the form below to compare companies of your choice:
Best of all – we offer completely Free 7 Day Trial – if you are not happy, cancel at any moment and we will not charge you a penny!
However we are sure you will be happy!
Get 3 months FREE!
Comments are closed